Reporting is key when striving for service excellence. At TOPdesk we see a lot of customers wanting to go the extra mile. We want to enable you to get more out of TOPdesk’s data, so let us introduce a new feature to you.
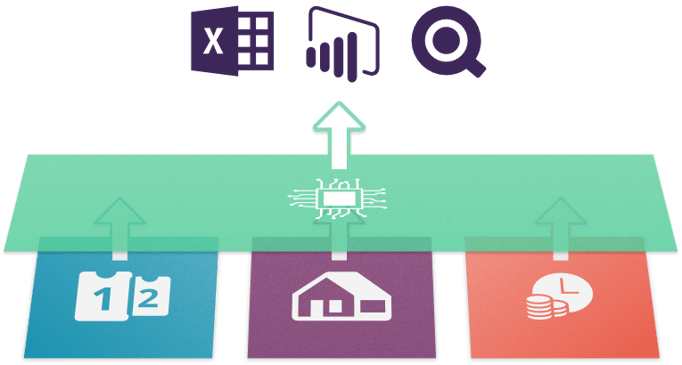
In short: we’ve released our OData feed – an API to get data from TOPdesk in a format suitable for various business intelligence tools, such as Microsoft Power BI.
In this blog, we’ll show you what you can achieve with the free version of Power BI.

Publishing reports for your users
To publish reports for others to see, there are a few easy steps to take. First, you gather the data into your business intelligence tool. You access the Reporting API using a designated operator with Reporting API permission, and with an application password created. Then you can use any BI tool – for example the free version of Microsoft Power BI – to easily fetch your data from an OData feed. Alternatively, you could use Microsoft Excel which also supports the protocol. For a quick tutorial check out developers.topdesk.com.
Once you have your data loaded in Power BI you can create widgets to put on your dashboard for your users to see. The widgets interact with each other as you click on certain elements, allowing your users to refine the reports further by themselves.
Make sure you have a clear goal and target group for your report. Different groups of users want to see different things, or may not even be allowed to see all the data available. Create some report widgets on the dashboard and check with your users whether the reports solve their needs.
When you feel you’re done, get ready to publish! Note that if you want to publish your dashboard to other users you need to pay for that, since the free version of Power BI does not allow you to. Of course the dashboard is not just a static board. You can simply trigger a manual refresh, or set up a schedule for Power BI to fetch your data, in order to create and publish daily, weekly or monthly reports.
To help get you started, we published a short tutorial on developers.topdesk.com. It will explain you how to set up the correct permissions in TOPdesk and how to access the OData feed with Microsoft Power BI.


